
Climate averages and a headland forecast answer different questions
Cape Point weather needs more than a monthly temperature average. Before a visit involving paths and viewpoints, check the conditions for the actual day and choose suitable clothing. SANParks' walking guidance calls for a windproof layer, warm clothing, rain protection, sun protection and water. A mild regional average is not a reason to arrive unprepared for an exposed headland.
The table below is a historic regional reference for Cape Town Airport, WMO station 68816, at an elevation of 46 m. The DWD normal period is 1961 to 1990. It is not a Cape Point station series or a current weather forecast. For the wider seasonal choice, read the best-time-to-visit guide.

A guided day with vehicle transfers
Air-conditioned transport connects the stops on this small-group outing; prepare separately for outdoor coastal conditions.
Hand-picked tours, booked through GetYourGuide. Prices are indicative starting prices in US dollars (as of October 2026). Tap a tour for live availability and the current price in your currency.
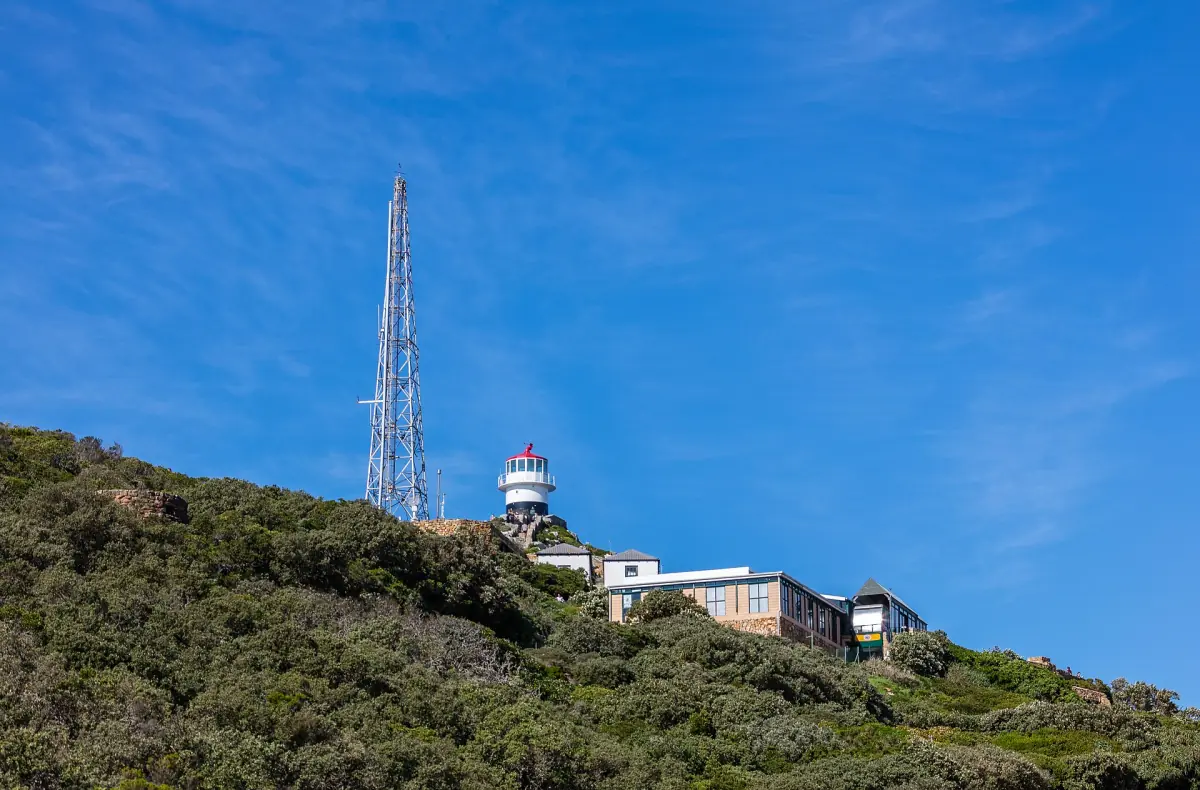
Compare Cape Peninsula tours
Compare routes from Cape Town, with park entry and other inclusions checked for each option.
Monthly regional climate reference
Highs and lows are monthly averages of daily maximum and minimum temperatures. Rainfall is the average monthly total. They describe an older climate period at the airport station and are shown here as regional planning context. They are not measurements from the headland, current-year observations or a probability that your selected day will be dry.
| Month | Mean daily high °C | Mean daily low °C | Monthly rain mm |
|---|---|---|---|
| January | 26.1 | 15.7 | 15 |
| February | 26.4 | 15.5 | 17 |
| March | 25.4 | 14.2 | 20 |
| April | 23 | 11.9 | 41 |
| May | 20.2 | 9.4 | 69 |
| June | 18.1 | 7.8 | 93 |
| July | 17.4 | 7 | 82 |
| August | 17.8 | 7.5 | 77 |
| September | 19.2 | 8.7 | 40 |
| October | 21.3 | 10.6 | 30 |
| November | 23.5 | 13.1 | 14 |
| December | 24.9 | 14.9 | 17 |
The historical series has warmer, drier summers and cooler, wetter winters. February's mean high is 26.4 °C, while June has an average rainfall total of 93 mm. Those figures help compare the regional seasons. They do not establish a particular wind speed on a cliff path or the conditions at a viewpoint when you arrive.
Wind, clothing and the walking plan
Choose clothing for a sequence of activities rather than only the warmest expected part of the day. A road tour can involve getting out at viewpoints, and a walk requires its own preparation. The park's windproof and rainproof clothing advice remains useful even when the airport temperature appears comfortable. Carry water and use footwear suited to the route you intend to take.
Do not transfer airport wind information directly into a claim about the exposed cliffs. If you depend on a particular path, ask about current access and read the day's instructions. The walking guide explains route planning and the difference between a short visit and an overnight trail. Weather should be one reason to adjust the programme, not a reason to ignore a closure or hurry onto an unsuitable route.
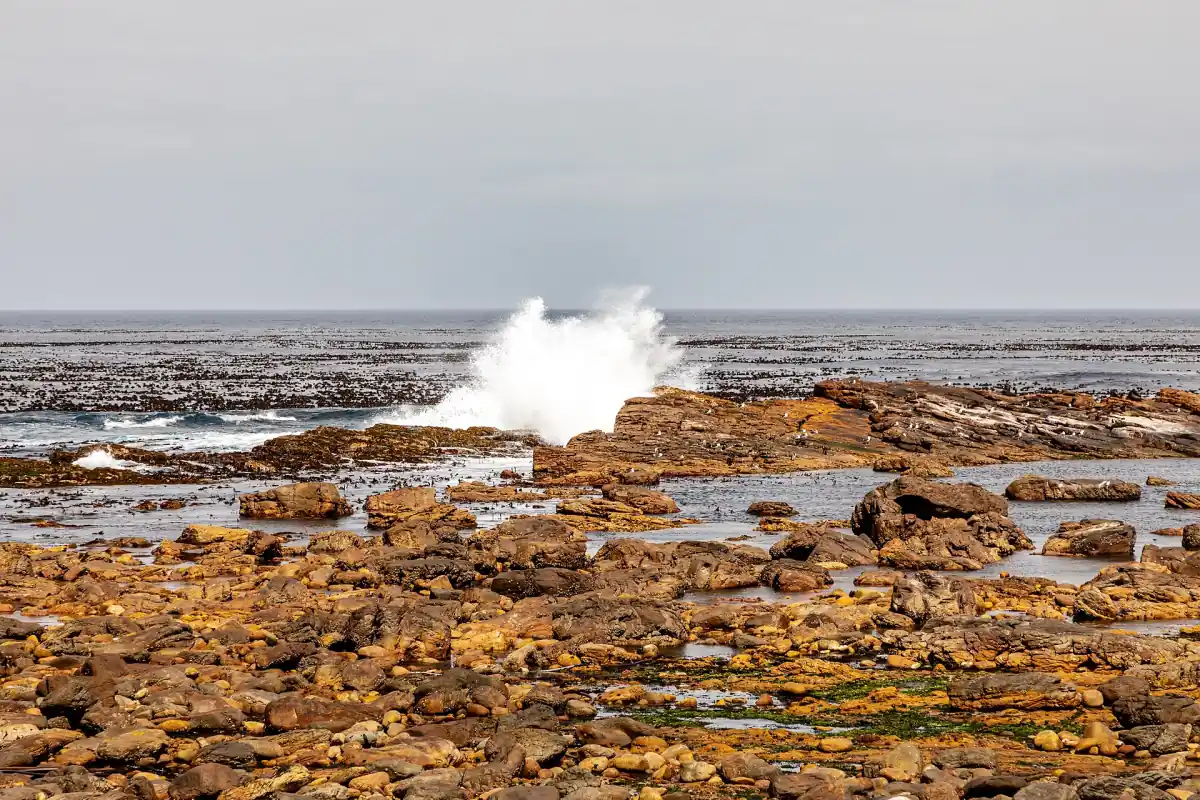
Transport, railway and the return to the gate
A guided trip can organise transport, but its overall length does not guarantee time for every viewpoint in all conditions. Compare the actual programme on the tour page and ask how optional walks fit into the day. If you prefer the railway to the ascent on foot, check its service rather than assuming a universally operating alternative. The funicular guide covers the separate ticket and timetable.
Leave space for the return journey through the park. Gate hours and railway hours are different constraints, and clear weather does not extend either of them. The opening-hours guide helps separate the two. A beach photograph is also not a bathing assessment: Diaz Beach has a swimming prohibition and should not become a spontaneous swim stop on a warm day. Choose your plan with the route, current conditions and permitted activities together.
Questions before your visit
Are these climate values measured at Cape Point?
No. The table is a historical DWD reference for Cape Town Airport, station 68816, for 1961 to 1990. It is clearly a regional proxy. It must not be read as a modern monthly series from the headland itself.
Can I expect a dry day in summer?
The historical regional summers are generally drier than winter, but that does not guarantee the weather on a particular visit. Check the actual forecast and park instructions, and carry the clothing and water appropriate for the route you choose.
Do the monthly temperatures tell me how windy the cliffs are?
No. Temperature averages and airport measurements do not establish a wind speed at an exposed coastal viewpoint. Assess the visit using current local information and the park guidance, especially before starting a walk or depending on a particular path.
Can I swim at Diaz Beach when the weather is warm?
No. SANParks prohibits swimming at Diaz Beach because of strong rip currents. A warm day or calm-looking photograph does not remove that rule. Read the separate beach guidance before including any water-based activity in your visit.